Changes in the housing price statistics
From January 2024, there will be changes to Eiendom Norge's house price statistics.
The changes in Eiendom Norge's housing price statistics can be summarized in the following points:
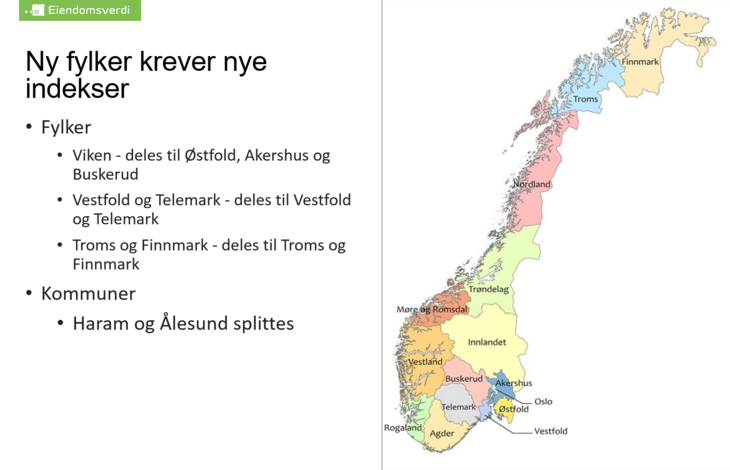
• New county indices, for each of Norway's 15 counties
• The static model behind the index has been revised.
• A truncated average is now used instead of the median when calculating the underlying price development
• New technology makes the index better able to correct for differences in housing composition from period to period
• This results in less volatile indices
• Weighting from indices for sub-areas to county indices, and weighting from county indices to Norwegian indices, is now a transaction-weighted average of the monthly price development for the areas
• Seasonal adjustment has been updated to newer software (X-13-ARIMA-SEATS)
• The index and other key figures such as volumes and number of unsold will have new history
In connection with county changes in January 2024, the geography in the housing price statistics must be updated to reflect the new county division. We now get a separate index for each of Norway's 15 counties.
On that occasion, Eiendomsverdi AS has also carried out an audit of the way price developments are calculated. The cornerstone of the index is a statistical model, which estimates the housing value of sold homes. This checks that the characteristics of the typical home sold vary from month to month. The model must be updated from time to time, because supply/demand for individual properties or the location of homes changes over time. This may include situations where new neighborhoods are being developed. The development of machine learning algorithms has made models for estimating housing values more accurate compared to the traditional linear regression. The house price statistics now make use of this technology. This results in less volatile indices.
In order to be able to present indices with a granular geographical resolution, while reporting on months (house price statistics) and quarters (regional reports), statistical processing must be done to reduce random variation in the time series. As the model behind the indices is better at estimating housing values, less statistical processing is needed.
The county indices are a weighted average of the areas in the county, where the weights are given by the sales of the last 24 months. With the exception of Oslo, the entire county is not covered by the sub-areas reported in the house price statistics. In these counties, the reported indices are aggregated and an overall index for the rest of the county is aggregated. This aggregate index is not reported. The aggregation consists of a weighted average, where the weights are determined by the number of sales in the last 24 months.
The same method is used to calculate the Norwegian index based on the county indices. Before January 2024, this weighting was based on the index number (e.g. 350), now this is based on the percentage price increase for a given month. In practice, this means that areas with historically high price growth are given slightly less weight.
The seasonal adjustment of the indices is done to find the underlying growth adjusted for the seasonal patterns in the price development. Typically, prices rise most in the first part of the year, then fall throughout the autumn and throughout the year. This seasonal adjustment has been updated, and now uses the X-13-ARIMA-SEATS software. The changes in the seasonal adjustment will have marginal effects on the measured seasonally adjusted price development.
The history of the indices will be recalculated to take advantage of the increased quality in the model. The history of the sub-areas will nevertheless be unchanged before June 2010. The counties and Norway will have changes in the index, going all the way back to 2003, as a consequence of the changes in weighting.
Other key figures such as volumes and the number of unsold homes will have a new history going back to 2003. Regeneration of the figures will result in certain shifts back in time, in particular this will apply to the figures relating to unsold homes and housing price developments.


