House prices - first half of 2019
How was the price development in the first half of 2019?
Prior to 2019, people were anxious about the consequences that rising mortgage rates and increased housing offers would have for Norwegian housing prices. We now have half a facet for 2019 and in this fact about the housing market, Eiendomsverdi AS will summarize price developments in the first half of the year.

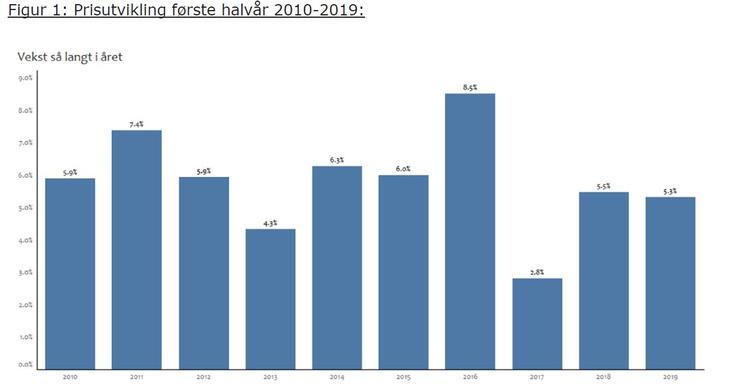
Chart 1 shows price trends in the first half of the last 10 years. We can see from the figure that prices have risen 5.3 percent so far this year. In the ten year period, it was only 2013 and 2017 that we observed lower inflation in the first 6 months. Price trends are on a par with 2018. In 2018, the year ended with a price increase of 2.8 per cent. This corresponds to inflation, so the real prices were unchanged.
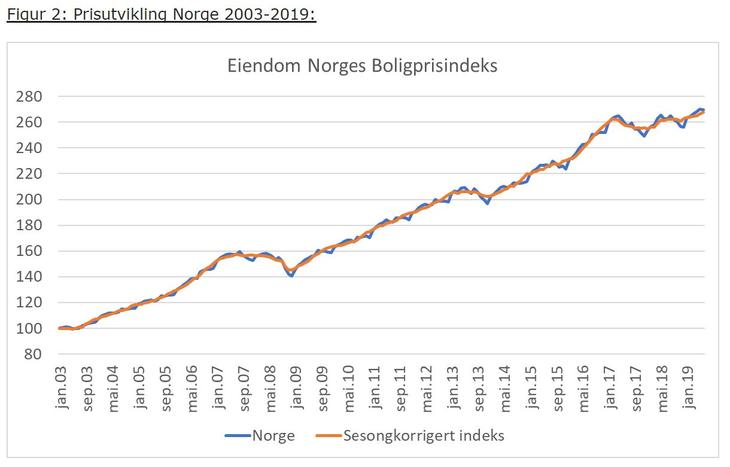
Chart 2 shows Real Estate Norway's house price index since 2003. The index shows that inflation is slowing, but we have never had higher house prices than we have now.
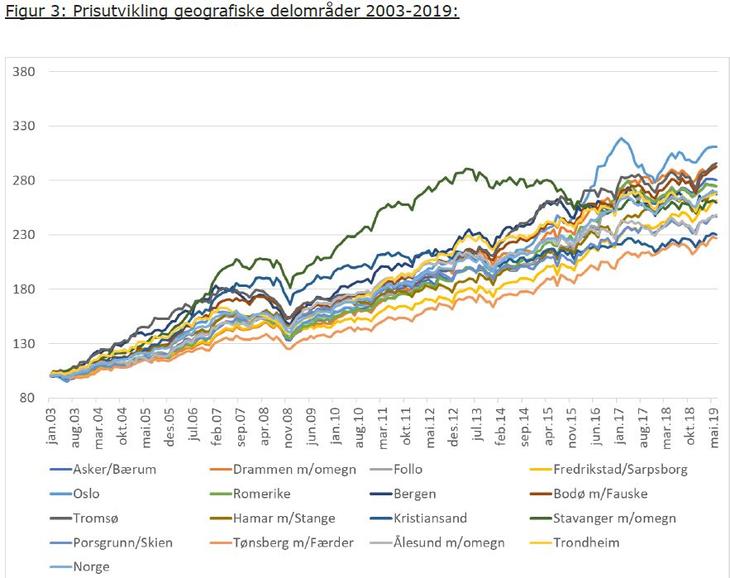
Figure 3 shows that we are close to or at record levels throughout Norway. Stavanger is the exception, where prices are 10 per cent lower than they were in 2013. Oslo is 2.5 per cent below the top quotation from February 2017.
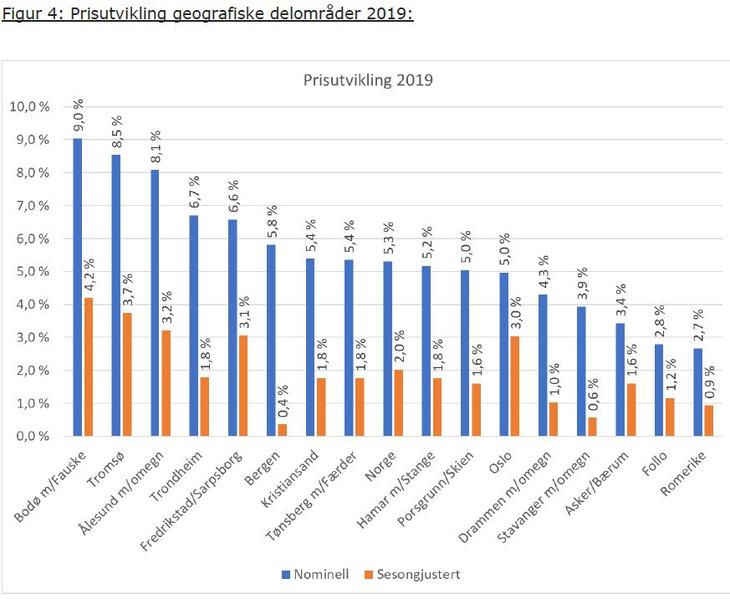
Figure 4 shows the price trend so far in 2019 for selected areas in Norway. There has been strongest price growth in Bodø and Tromsø, while the border zone around Oslo has had the weakest price growth. There are seasonal patterns in house prices. The orange pillars are inflation adjusted for the season.
We see from the seasonally adjusted figures that there has been underlying inflation in all areas. The underlying price growth is strongest in Bodø, Tromsø and Ålesund. Stavanger and Bergen have had the weakest seasonally adjusted development.
Summary
Norwegian house prices have never been higher, but inflation has leveled off. So far in 2019, underlying inflation is directly above inflation. Interest rate increases and increased housing supply have not led to falling prices so far.


