Changes in the Housing Price Statistics
In 2018 there will be several changes in the Norwegian Housing Price Statistics.
The changes in Real Estate Norway's housing price statistics can be summarized in the following points:
- In the calculation of "Number of unsold", a dwelling was previously removed after 270 days from the registration date and now this limit is 180 days.
- In "Time on market", the calculation of the number of unsold is changed from being based on a weighting of the number of days an unsold home has been on the shelf to using a two-step methodology where one first records the median bed time of all unsold for each day in the month and then find the average over these 28/30/31 medians.
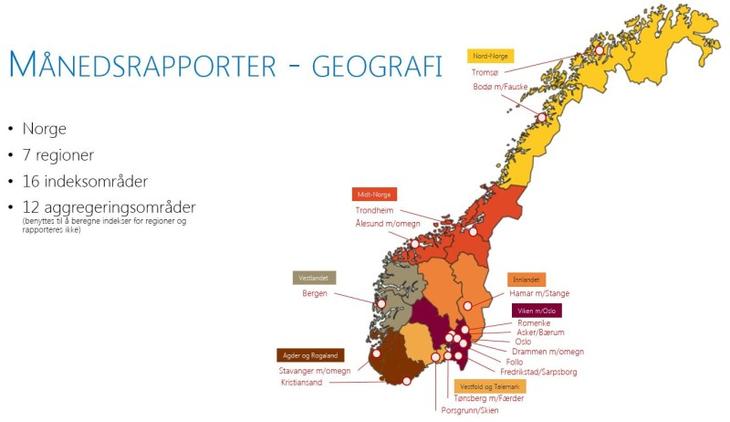
- A change has been made to the division into regions and areas.
- Reports are produced for 7 regions and 16 sub-regions.
- There has been a change in the methodology behind smoothing / de-smoothing.
- The data period for which the degradation factors are calculated has been reduced from 2 months to 1 month.
- There is now no dis-aggregation in housing types.
- A change has been made to the calculation of the Norwegian Index.
- From being a separate median calculation of all data points in Norway, it is now a sales volume-weighted up-aggregation of the indices in the sub-areas.
- Work has also been done on data quality, which among other things affects the classification of housing / ownership. This gives some minor adjustments in, for example, sales volumes.
The first change takes place in January and is a restructuring of the statistics history.
The new history is now available for our subscriptions and members in our portal.
This rescheduling was initially announced in May 2017 at the same time as the methodological adjustment of the de-smoothing areas.
Real Estate Norway, in consultation with our statistical producer Eiendomsverdi AS, has chosen to adjust the method again, since for several months this has created less intuitive differences in the price trend between the national and regional indices.
From January 2018, the Norwegian index will be an up-aggregation of the sub-regions, which will make price developments in the regions and the country as a whole easier to interpret.
De-smoothing from two to one month
From the change in May 2017 to December 2017, the de-smoothing factor was calculated over two months.
From 1 January 2018, the de-smoothing factor is calculated over a month.
This implies a significantly more sensitive index.
Low transaction volume means that the indices must be statistically processed (smoothing and de-smoothing) in order to show as accurate a picture of price developments as possible.
This is particularly evident in months of low transaction volume as in July and December, and we urge users to note that there are challenges associated with creating house price statistics in these particular months.
Therefore, in order to avoid too much statistical processing of the data and to create statistics in areas with low transaction volume, we have decided to reduce the number of areas we report from, as well as eliminate the difference between types of housing in the monthly reports.
New geographical areas
Low transaction volume means that it will not be technically justifiable to create monthly house price statistics for the 92 areas we report today.
This means that we now reduce the number of areas on a monthly basis, and will only report developments in housing types (detached, shared housing and apartments) once a year.
From January 2018, ie at the release on February 5, and in new history we will now report price trends in 16 geographical areas, 7 regions, and Norway as a whole.
These are the areas we will report monthly from January 2018: (Click image for larger version).
As a result of this new division, we will also change the current county reports that are published quarterly.
From today's 19 counties, the country will now be divided into seven regions, each of which will have its own report.
In addition to the 16 areas, quarterly reports will have price indices of 92 sub-areas consisting of several smaller cities and municipalities.
Timetable for the changes
We ask our users to note the following dates in 2018:
February 5: Release of Real Estate Norway's house price statistics, January 2018. First monthly report with new method
April: Release of Real Estate Norway's house price statistics, regions, Q1 2018


